
 Guillaume Lebedel · · 6 min read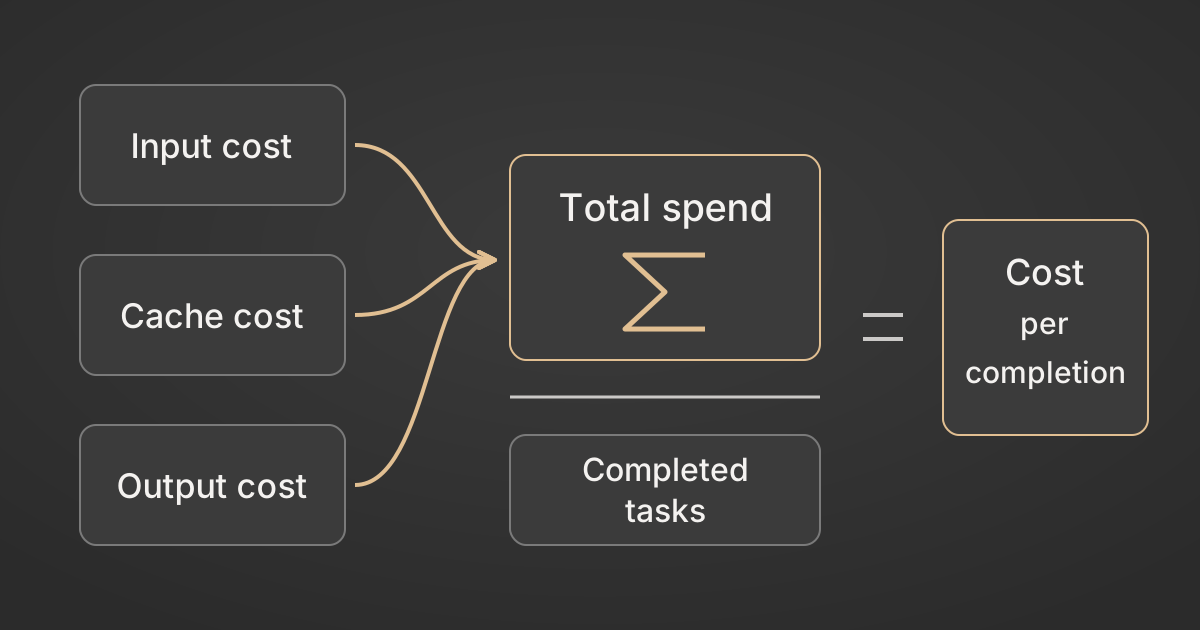
Why cost per task replaced price per token
Table of Contents
On 22 September 2026, OpenAI announced lower API rates for GPT-6 Sol and Luna, while Anthropic said Claude Opus 5.5 costs 40% less to run than Opus 5 at default settings. These headlines measure different things. An API rate tells you what a category of tokens costs. Running cost also depends on how many tokens the agent uses, which categories they fall into and whether the task succeeds.
For a team paying an agent bill, dollars per completed task is the useful comparison. It connects the invoice to work delivered.
What is cost per completed task?
Start with each model call. Multiply each disjoint billable token category by its applicable rate, then add the charges. Sum every call across successful, failed and abandoned attempts, and divide by the number of tasks that meet your predefined success criterion.
call spend = sum(category tokens × category rate)
cost per completed task = total model spend / completed tasks
If rates are quoted per million tokens, divide each token charge by one million. Normalize the provider’s usage fields first: a total input count may already include cached input, so adding both without subtracting the overlap double-counts it. Cache writes can have different rates by retention period. Keep external tool charges and human fallback costs alongside model spend if they are outside this definition.
A rate-only change on an unchanged model can lower spend without requiring a behavioral migration. Switching to a new model or version requires evaluation even when the vendor attributes its lower price to serving improvements. GPT-6 is a model change, and its workload results differ from GPT-5.6.
Why did a 50% price cut produce different per-task savings?
Artificial Analysis’s evaluation, published on 22 September, measured more output tokens per Intelligence Index task from both new models at maximum effort.
Its measured benchmark cost per task fell from $1.99 to $1.06 for Sol, about 47%, and from $0.18 to $0.07 for Luna, about 61%. These rounded benchmark figures include more than output tokens, so the chart alone cannot reconstruct the bill.
Artificial Analysis reports weighted cost per benchmark task, using task count as the denominator. The cost per completed task defined here divides all spend by successful outcomes.
| Model transition | Input, per 1M tokens | Output, per 1M tokens |
|---|---|---|
| GPT-5.6 Sol to GPT-6 Sol | $4 to $2 | $20 to $10 |
| GPT-5.6 Luna to GPT-6 Luna | $0.20 to $0.10 | $1.20 to $0.50 |
Source: OpenAI’s GPT-6 Sol and Luna announcement, 22 September 2026. OpenAI describes the cuts as 50% against GPT-5.6 promotional pricing; Luna’s listed output rate falls about 58%.
OpenAI attributes lower rates to caching and inference improvements. That makes the new models worth testing, but lower serving costs do not establish equivalent behavior. Artificial Analysis also measured regressions on its knowledge-work evaluation. A team producing reports or presentations needs to check deliverable quality, even if an aggregate intelligence score stays similar.
What does Anthropic’s 40% saving establish?
Anthropic’s Opus 5.5 announcement reports lower running costs at default settings and fewer tokens per task. Its pricing table contains different reductions by category:
| Category, per 1M tokens | Opus 5 | Opus 5.5 | Rate reduction |
|---|---|---|---|
| Uncached input | $5 | $4 | 20% |
| Output | $25 | $20 | 20% |
| Cache reads | $0.50 | $0.20 | 60% |
| Cache writes, 5-minute TTL | $6.25 | $5 | 20% |
That mix matters. A workload dominated by cache reads receives a different effective rate cut from one dominated by output. You cannot subtract the 20% input/output cut from the 40% running-cost claim and attribute the remainder to fewer tokens.
In a hypothetical workload where every applicable rate falls 20% and the token mix stays constant, a 40% bill reduction would imply 25% fewer tokens: 0.60 / 0.80 = 0.75. The announcement does not establish those assumptions, so that calculation is not a measurement of Opus 5.5’s token reduction.
Effort changes the comparison too. Artificial Analysis measured roughly 119k output tokens per task for Opus 5.5 at max effort against 73k for Opus 5, with benchmark cost per task roughly level. A 20% output-rate cut alone cannot offset approximately 1.6 times the output: 0.8 × 1.6 = 1.28. The full bill also reflects input, caching and the evaluation’s usage mix.
How should you compare effort settings?
Evaluate each model at settings that could meet your product’s quality and latency requirements. A setting named “max” is not a standardized compute budget across versions or vendors. Copying the label from one model to another does not hold the experiment constant.
Record the exact model, effort, prompt, tool surface and retry policy for every run. Compare the cheapest configuration that clears the same acceptance criteria for each task class. A document extraction step may have a different acceptable configuration from a repository-wide code change.
If your evaluation uses one setting and production uses another, rerun the comparison with the production configuration before budgeting against it.
What belongs in the cost dashboard?
Lead with total model spend divided by completed tasks, then show success rate and human fallback work beside it. A falling ratio can still conceal a worse product if cheaper rates compensate for more failures.
Use these trace measurements to locate the cause of a change:
- Preserve retry and abandoned-attempt spend under the original task ID.
- Record which tool actions were needed, repeated or unsuccessful. Several tools can run between model calls, so tool-call count is not a direct token multiplier.
- Separate uncached input, cache reads, cache writes and output using the provider’s accounting rules.
- Measure the tool definitions and returned context the model receives. A growing catalogue can add prompt tokens without adding useful work; see the agent tool count ceiling.
For a trace-level breakdown, see where your agent’s tokens go.
Run representative tasks through the candidate configurations, retain failures in the totals and compare the results against your quality requirements. The model-swap evaluation runbook gives a worked example of that calculation and the uncertainty around a migration decision.
Prices and benchmark figures checked against the linked sources on 25 September 2026.