
 Guillaume Lebedel · · 6 min read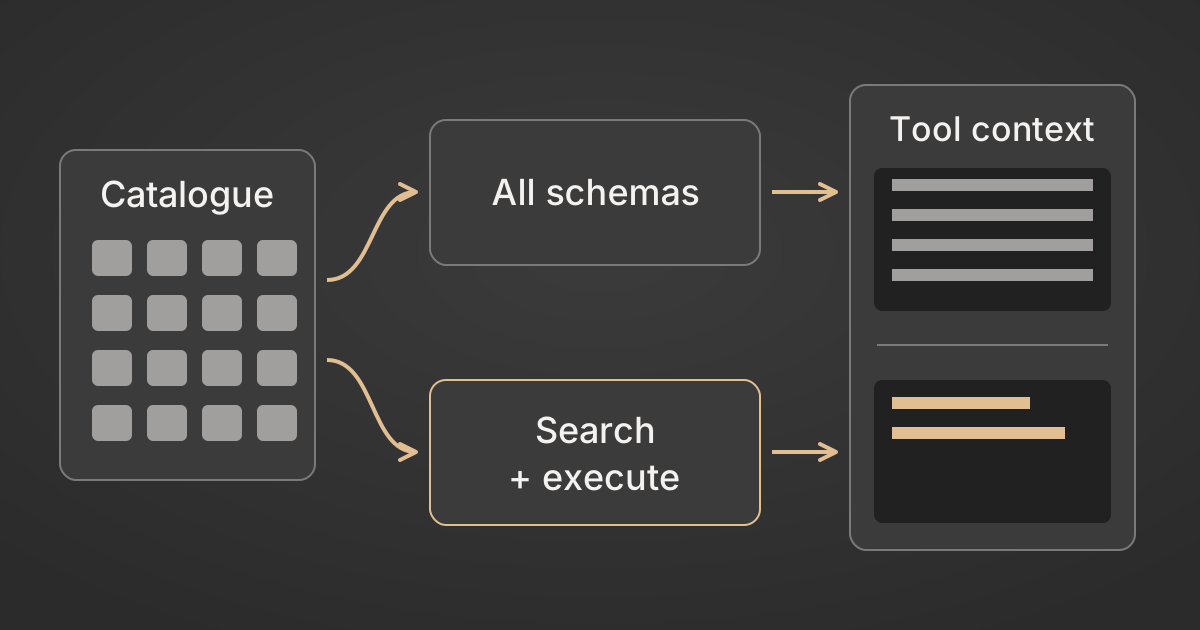
Where your agent's tokens actually go
Table of Contents
Token usage is the part of an agent’s bill your team can optimize directly. Tool definitions, accumulated history, returned documents and repeated attempts all affect what the model processes. The right intervention depends on which of those contributes most to your workload.
Start by measuring actual calls and completed tasks. A lower rate can help while the agent becomes less efficient, and a smaller prompt can save tokens while making task completion worse. You need both cost and outcomes to judge a change.
How do you calculate the bill correctly?
For each model call, multiply the tokens in each disjoint billing category by that category’s rate and add the charges. Include uncached input, cache reads, applicable cache-write tiers and output. Sum all calls and attempts, then divide by completed tasks.
model spend = sum of all model-call charges
cost per completed task = model spend / completed tasks
Normalize provider usage fields before calculating. If total input already includes cached tokens, separate those categories rather than charging cached input twice. A task with no successful completion still contributes its spend to the numerator. With zero completions, report the ratio as undefined and expose the spend and failures.
Four counters help explain the bill, but they are diagnostics, not factors to multiply:
| Counter | What to inspect | Accounting caveat |
|---|---|---|
| Model calls or turns | How long the agent keeps reasoning | Count each actual model call once |
| Tool calls | Unnecessary actions and repeated reads | Multiple tools may share one model turn |
| Context per model call | Schemas, history and tool results | Separate cached and uncached input; track output too |
| Retries | Work repeated after a failure | Retry calls may already be included in the turn count |
Attach these records to a stable task ID. Otherwise a retry can appear as an unrelated cheap request while the original task’s cost disappears from the report.
What do the September model releases tell us?
They show why rates and usage need separate measurements. Anthropic’s Opus 5.5 announcement reports a 40% running-cost saving at default settings. Uncached input and output rates fell 20%; cache-read rates fell 60%. Those figures do not establish that half the saving came from the price sheet or that token usage fell by a quarter.
A model change can also increase usage while lowering the bill. Artificial Analysis measured GPT-6 Sol using 31k output tokens per Intelligence Index task versus 29k for GPT-5.6 Sol. Luna used 51k versus 41k. The associated benchmark costs per task fell about 47% and 61%, respectively.
Artificial Analysis uses task count as the denominator, with benchmark weighting. Cost per completed task, as defined above, divides all spend by successful outcomes.
Those are benchmark observations, not a forecast for your agent. The cost-per-task comparison separates the published rates, token counts and effort settings. For optimization work, your next step is to break down your own traces.
Why do unused tool definitions occupy context?
A definition included in the request is part of the model’s input, whether or not the tool is called. Supplying every available schema makes that input grow as the catalogue expands. Caching can reduce its price, but it does not make the definitions disappear from the context window.
StackOne’s search and execute tools provide a search operation and an execute operation. The definitions for those two operations remain small as the catalogue grows across 530+ connectors. Search results and returned data still enter the conversation, so total context and total spend are not fixed.
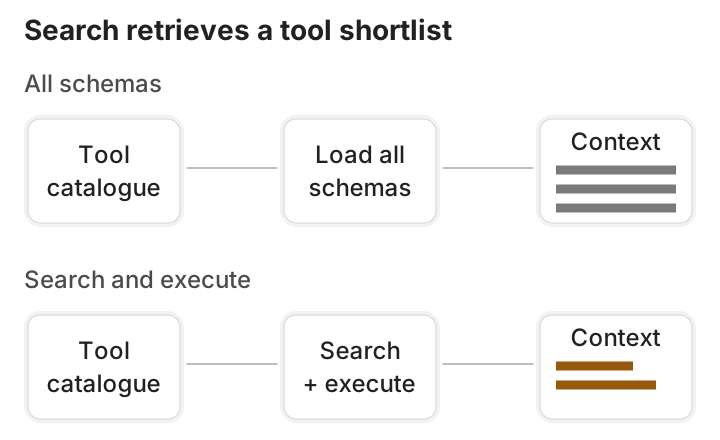
The catalogue and task are held constant in this schematic. Search results and tool data still add context.
| Load all enabled schemas | Search and execute | |
|---|---|---|
| Initial tool definitions | Grow with the enabled catalogue | Two discovery/execution operations |
| Context added during the task | Tool results and history | Search results, tool results and history |
| Additional discovery step | None | Search before execution |
| Main failure to measure | Wrong or ambiguous tool selection | Missing or irrelevant search results |
| Useful comparison | Small, stable tool sets | Broad catalogues with task-specific needs |
This is a design comparison, not a claimed percentage saving. Measure the extra search step and any additional model call against the definitions it removes. A handful of clear tools may be cheaper to expose directly. For the selection-quality evidence, see the agent tool count ceiling.
How can you preserve the prompt cache?
Keep stable instructions and tool definitions early in the prompt, with changing task data later. Measure cache hits and misses before assuming that repeated context receives a discount.
OpenAI’s GPT-6 caching guidance requires stable tool definitions, schemas and ordering. Change which tools are callable with allowed_tools, or use tool_choice set to none, instead of deleting definitions. To change reasoning effort while preserving reusable context, append a configuration_update and leave request-level effort unchanged.
These mechanisms do not make arbitrary schema changes cache-safe. They also solve a different problem from trimming the tool surface: restricting availability can preserve a cached catalogue without reducing the definitions supplied. Compare smaller prompts and better cache reuse using actual billed usage.
Which optimization should you try first?
Choose the largest measured source of avoidable spend, then change one thing at a time on a fixed task set.
Reduce unnecessary context. Measure schema tokens and tool-response sizes. Try a curated tool set, retrieval or bounded response fields. Check that removing information does not increase failed searches, extra turns or incorrect answers.
Test effort by task class. Run candidate settings against the same quality requirements. Record output tokens and latency as well as success. A setting that saves tokens on one class can be unsuitable for another.
Bound repeated work. Track retries under the original task ID and set an explicit attempt budget. Distinguish transient tool failures from an agent repeating an approach that already failed. Inspect abandoned tasks as well as eventual successes.
Keep the dashboard failure-inclusive. Lead with total model spend across all attempts divided by completed tasks. Show success rate, abstentions, human fallback count and human time alongside it. Median and p95 spend among successful tasks help explain the distribution, but exclude failures and must be labeled as such.
If total spend rises while prices fall, check workload volume and complexity before assigning a cause. Then compare per-task usage and outcomes for the same task mix. The evaluation runbook shows how to keep cheap failed attempts from disappearing in that comparison.
Model figures and caching guidance checked against the linked sources on 25 September 2026.